The Hunga Tonga eruption on the 14th of January 2022 was one of the largest volcanic eruptions in the modern satellite era. With a variety of different observations, there is a lot we can learn about the eruption and its impact on clouds. The location of Tonga also gives us a unique opportunity to view the resulting clouds in 3D!
The Earth is orbited by a large number of satellites, collecting a huge variety of data about the atmosphere and the Earth surface. Particularly important here are the geostationary satellites. These are in a ring above the equator, orbiting the Earth at the same rate the Earth rotates, making them appear to 'hover' above the Earth. These satellites take an image of the hemisphere they can see every 10-15 minutes, which we can use to generate videos of the eruption like this one.
Tonga is conveniently located almost exactly inbetween two of these geostationary satellites: Himawari-8 (run by JMA) hovers over Indonesia and GOES-17 (run by NOAA) hovers just west of Hawai'i.
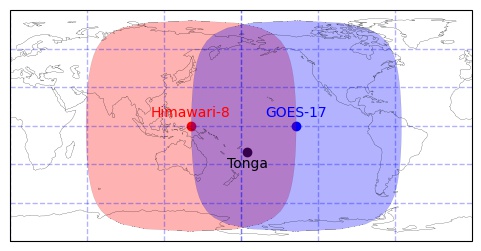
The fields of view of Himawari-8 (red) and GOES-17 (blue) near Tonga.
Each of these views Tonga at a slanted angle, such that tall things look like they are stretched out along the ground. Alone, neither satellite can tell the difference between tall cloud and a low cloud stretched out along the ground. However, when you combine two satellites, looking from different angles, you can tell the difference. Even better, you can actually measure the heights of the clouds!
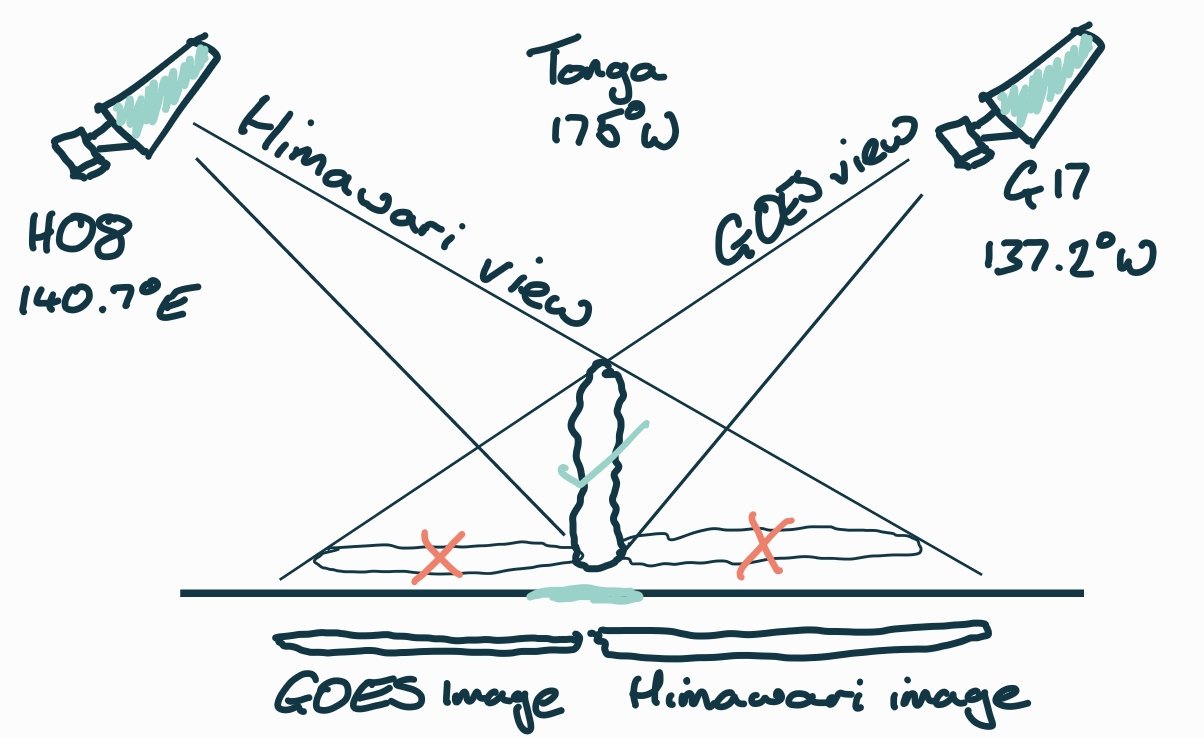
The principle behind the stereo height method. A single satellite can't tell the difference between a thin, tall cloud or a long low, one. But used together, they can reconstruct the cloud in 3D.
To actually make the measurement, we have to modify the images slightly. First, we re-project them as if the satellite was directly above Tonga. Notice in the next image that this changes the cloud from an oval to more of a circle, as you might expect as the cloud is spreading out in all directions. We also have to rotate the images slightly so that the change in position due to height is only in the left-right direction.
We can then use a block-matching algorithm to calculate the distance between points in the two images and so the height of the cloud (shown in the central panel)
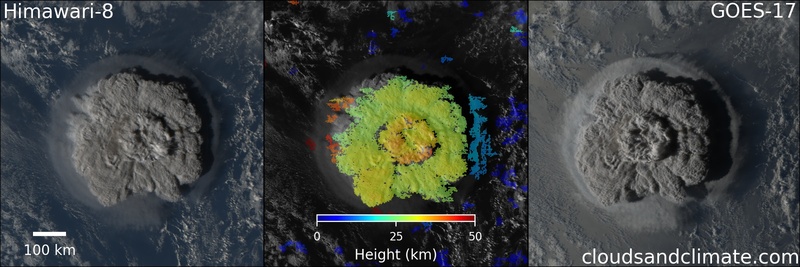
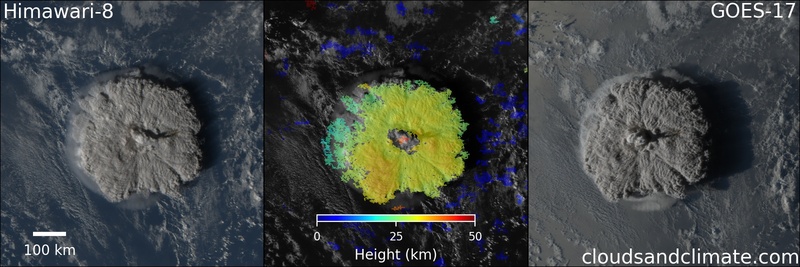
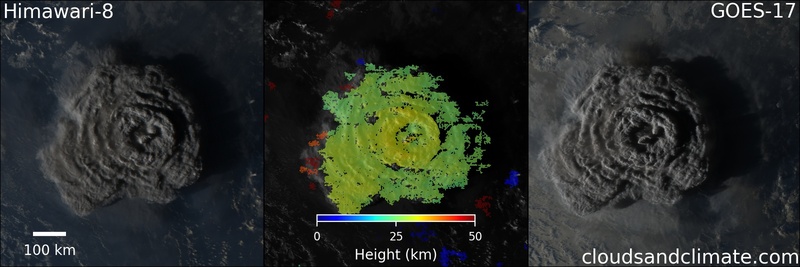
Two views of the Hunga Tonga eruption, about 1 hour after the initial plume formation. The Himawari-8 data is the 'left-eye' view and GOES-17 the 'right-eye'. Derived heights are shown in the centre, ontop of the Himawari-8 image. (Data from JMA/NOAA)
Similar to the values found by Simon Proud, the ash plume rises to about 35km, but there are parts of the plume that rise to nearly 50km, making it one of the tallest ash clouds ever measured. If we look at the images in sequence, we can see how the cloud evolves. Each of these images is separated by 10 minutes.
The eruption evolution
0 minutes (approximately)
Just before the plume becomes visible. The sea is brighter in the GOES-17 image as the sun is at the right angle relative to the satellite to reflect off the water.
10 minutes
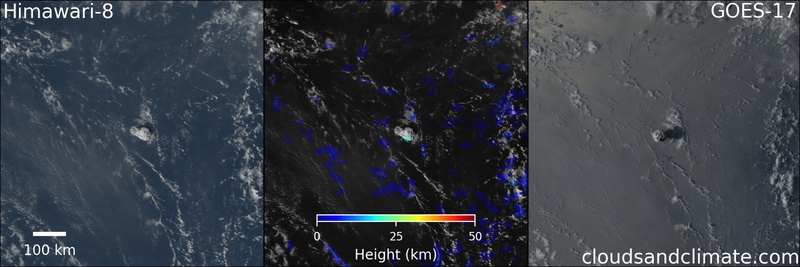
Although the plume looks small in this image, it is already close to 50km across and almost 20km tall. The dark blue heights are normal tropical clouds, with heights around 5-15km.
20 minutes
10 minutes later, the plume has reached almost 30km, and is over 100km wide. You can see the algorithm is also able to measure heights of lower parts of the plume , which are only 15-20km high.
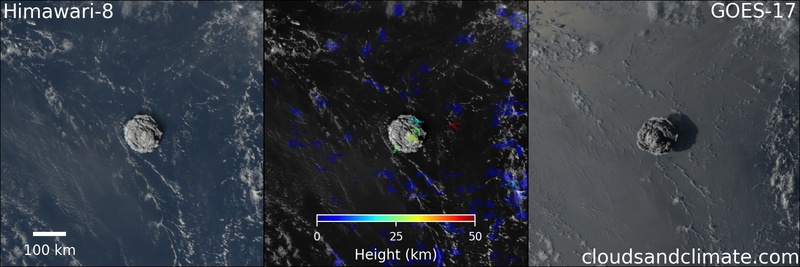
30 minutes
Within 20 min of the first image and half an hour of the initial formation of the plume, the top reaches over 40km. The plume itself is now 200km wide. The shockwave that circled the world (link) is just becoming visible under the ash plume. As it appears this late, this shows how the ash plume was already rising before the main eruption.
40 minutes
The top of the plume is levelling out at around 35km, but the shockwave is now becoming more clearly visible. At a low level, it is causing clouds to form in its wake. Given the shockwave was only just visible 10 minutes ago, this puts the speed at around 1200km per hour or around 330 ms-1 (the speed of sound).
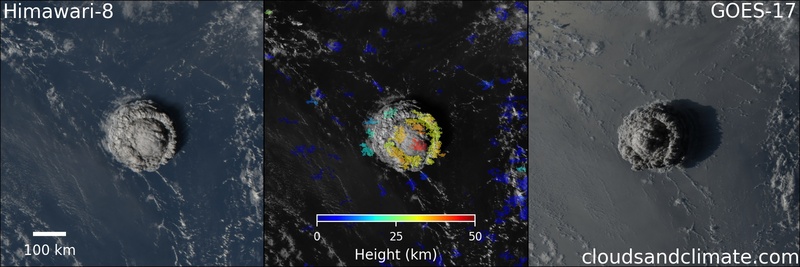
50 minutes
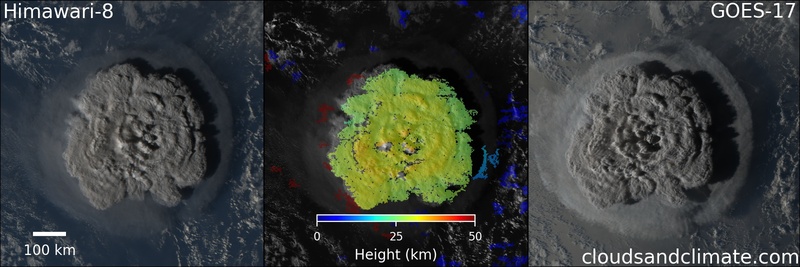
While the main ash cloud is settling down to around 30km, a new peak is appearing in the centre of the umbrella cloud, reaching up towards 40km. The algorithm is able to pick out some lower layers of the cloud at around 14km. This is the part of the cloud that is trapped below the tropopause, remaining in the lower part of the atmosphere and is likely composed mostly of water vapour. The main shockwave has now reached the edge of the image over 400km away.
60 minutes
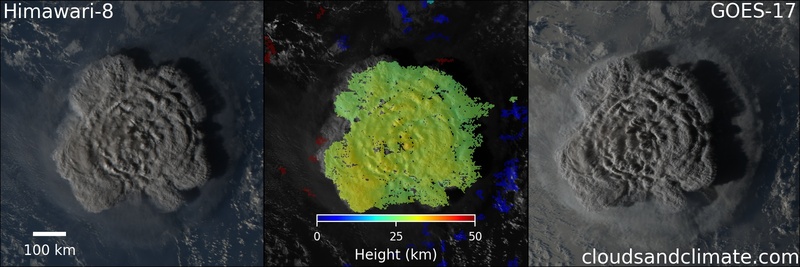
This new core has expanded in size, with tops at around 35-40km. The lower cloud has also expanded, moving slower than the shockwave at only 300km per hour. The algorithm has difficulty measuring its height as it doesn't have many obvious features. It does better on the right side of the image, where the shadow from the main plume is case on the lower level one. Here we see it is about 14km high.
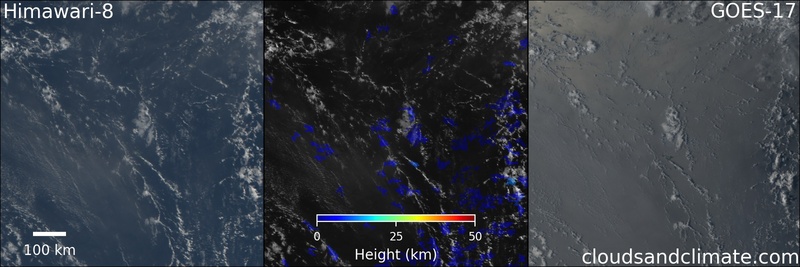
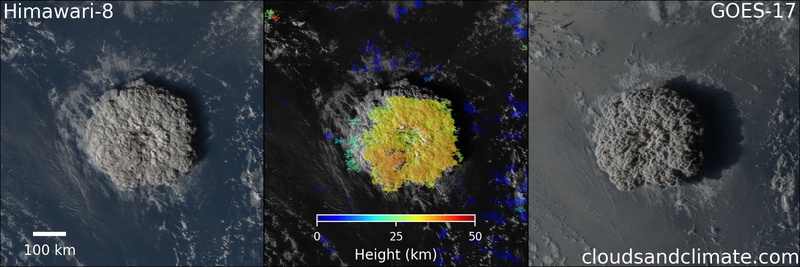
70 minutes
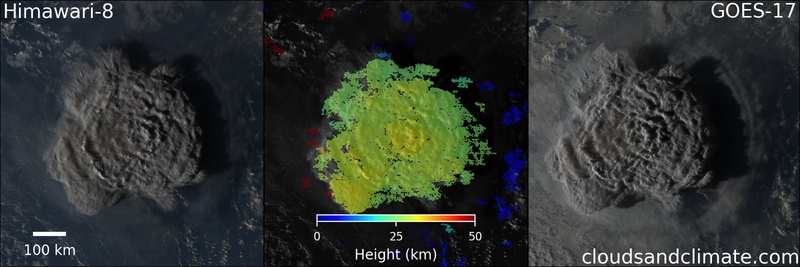
While this image looks like it has a flatter top, this is partly due to the simple nature of the height determination algorithm. Viewing this case in stereo (see later) shows a large number of features at the cloud top, including plumes of ash several kilometres high, above the main umbrella cloud.
The remainder of the images show the cloud spreading out and gradually settling (in part), until night arrives and it becomes difficult to identify cloud features.
Stereo images
While these images are amazing, it is even better to view them in stereo. It turns out it is difficult to do, as the spacing of the satellites makes this like viewing a volcano at the end of your nose.
With the large difference between the satellite viewing angles, wobblegraphs are a bit headache inducing. I don't recommend you look at this for more than a few seconds...
However, if you have access to anything capable of displaying 3D images, I really, really recommend it. I cannot emphasise this enough, the amount of detail you can pick out is amazing - the human brain has a lot of experience interpreting stereo images!
Here are the MPO and corresponding JPGs, sized for a Nintendo 3DS. If you don't already have one, it is a great excuse to get one - why should Death Mountain in the Legend of Zelda be the only volcano you see in 3D!
I can finally claim I use my one for work...
Comments by email