Super-HD videos from space
There is a ring of satellites taking high resolution pictures of Earth that are vital for modern weather forecasts. Each satellite takes the equivalent of a 470 Megapixel image [1] every 10 minutes. In some locations, they take an image every minute, showing the details of storms, how small clouds change and even rocket launches!
Not all the satellites in this ring have the same capabilities. Europe's contribution (the Meteosat series) takes images with a comparatively rubbish 67 Megapixel resolution. While this was state-of-the-art when they were launched, these 'second generation' observations have fallen behind the 'third generation' observations of the American and Japanese equivalents.
A new weather satellite for Europe
Luckily, the first of Europe's third generation satellites - the sensibly named 'Meteosat third generation' or MTG - was launched at the end of 2022. In May 2023, we got the first publicly released pictures. With a new, higher resolution camera, the flexible combined imager (FCI) on the third generation Meteosat gives us new detail in our views of Europe and Africa.
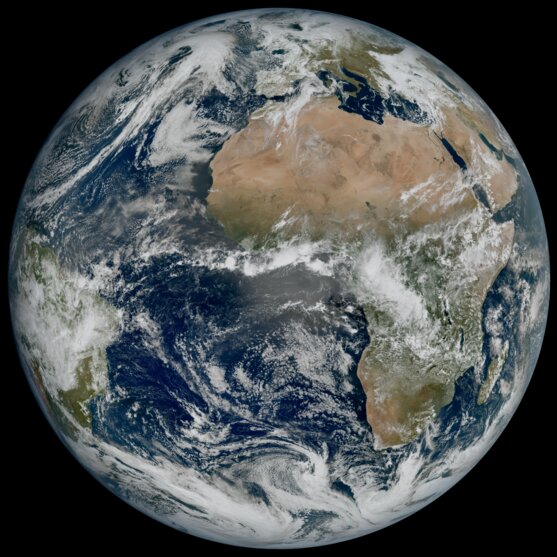
The Earth, as observed by the new third generation Meteosat (Image EUMETSAT/ESA)
Seeing the Earth at a higher resolution is already pretty useful, but there are other new things it can do. Compared to the older, second generation Meteosats, the new third generation can see more colours. For the first time, we have a Meteosat that can see blue!
'True colour'
You might have seen 'true-colour' pictures from the older Meteosats. While they show a lot of detail in the cloud and the surface, they also look a bit weird. The ocean is a single shade of dark blue and snow and some of the clouds appear light blue.
You will recall from personal experience that clouds are not actually blue.
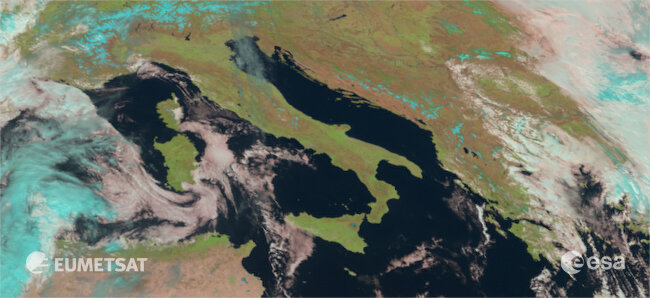
Italy and Southern Europe observed by the MSG satellite. The clouds look a little ... strange (Image EUMETSAT/ESA).
The blue clouds and snow are characteristic of second generation Meteosat images. The strange colours are because the image is not real at all, it's a fake!
A lack of infra-red
The older, second generation Meteosats cannot see blue or green, so the red, green and blue parts of this true-colour image are re-created from red and infra-red observations. This mostly works, giving us an image that looks pretty plausible. However, while clouds and snow reflect red, blue and green light, they strongly absorb infra-red light.
If you use infra-red to try and fake a true colour image, you don't get enough fake red light coming from the clouds and snow, so they appear blue instead [2].
As the new Meteosat can see green and blue [3], it doesn't need to use infra-red to make a fake true-colour image. The resulting image is much closer to what you would actually see (if you were in space).
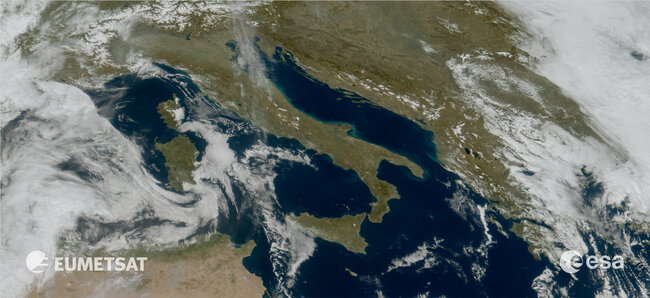
The same location, but seen from the new generation Meteosat. Note how the clouds are now white, rather than blue (Image EUMETSAT/ESA).
Benefits of blue
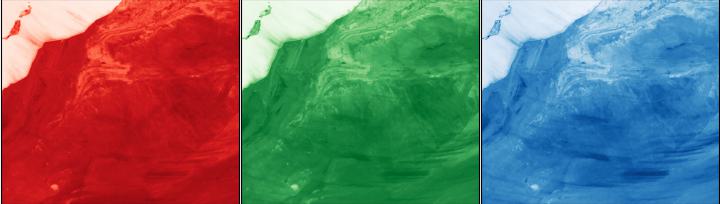
But seeing in blue doesn't just help you make nice pictures with sensible-looking clouds. It is vital to measure the colour of the ocean. Ocean colour helps locate phytoplankton and sediment, but to locate green plankton in a blue ocean, just being able to see red is not very helpful. Take this example off the coast of the Yucatan Peninsular in 2008.
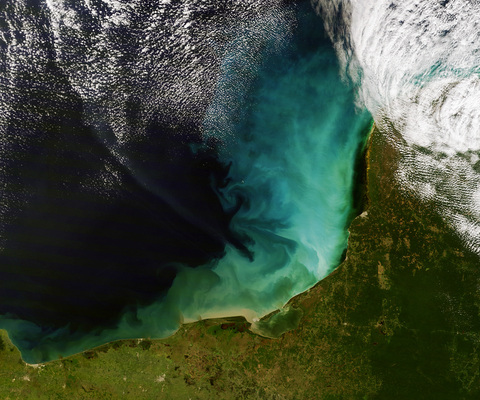
A phytoplankton bloom seen by the MODIS instrument(NASA Earth Observatory)
If we split this up into red, green and blue, we can see that although there is something visible when looking at red light, it is the green and blue that are really important. Even where the red is seeing something, this is more closely related to sediment, both from the river and the sea floor, rather than the phytoplankton. Without looking at blue and green, you can't see how large the phytoplankton bloom really is.
The same bloom, but split into red, green and blue data.
This explains why the ocean looked so boring in the older Meteosat image - it couldn't see blue or green very well, so it missed almost all the detail in the ocean.
Deep blue
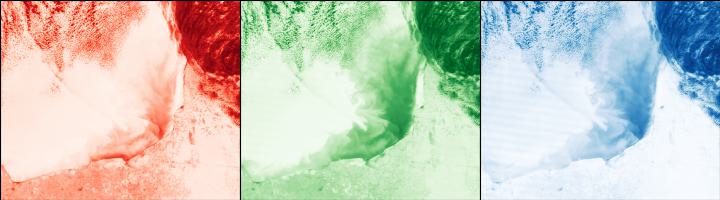
Another big benefit of seeing in blue is being able to see desert dust. Have a look at this picture of dust being blown off the Sahara.
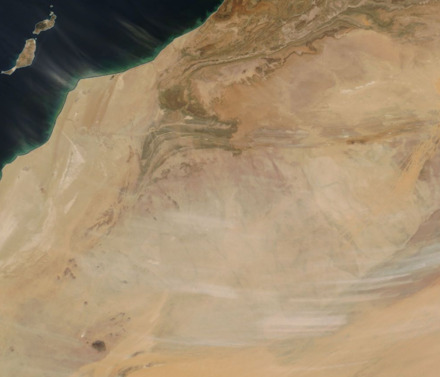
Plumes of dust being blown from the Sahara.
Plumes of dust heading out over the Atlantic near the Canary Islands are easily visible in the top left, but you can also see some white-ish streaks in the bottom of the image. This is desert dust being blown from the surface into the atmosphere.
While the dust on the ground has a reddish colour, once it is suspended in the air as aerosol particles, it reflects the different colours of light much more equally. This gives it a whiter colour when it is blown from the surface..
The red, green and blue channels.
When you look at the different colour components, the dust is hardly visible when looking at the red, but is very clear in the blue image as dark blue stripes in the bottom part of the image. You can kind of see why, the desert is kind of red, so there is already a lot of red light being reflected. The white dust in the atmosphere can't really reflect any more red light, so you can only see the dust when you look in green or blue.
This is the basis of the NASA Deep Blue method for measuring atmospheric aerosol. While this method can be used in most regions, it is particularly important for measuring aerosols over bright surfaces (like deserts). With blue and green data from the new generations of Meteosats, we will now get dust data across the largest desert region in the world in near real-time! [4]
A more colourful future
With their ability to see blue (and green), these new Meteosats will provide valuable new data about the interactions between the atmosphere, land and surface. Dust from the Sahara is a big supplier of nutrients to the Amazon rainforest [5], fertilises phytoplankton [6] and creates errors in European weather forecasts by modifying clouds [7]. Not only will the new third generation Meteosats produce nicer pictures of clouds, they will give us an amazing new tool for studying how the land, atmosphere and the oceans are connected.
Comments by email
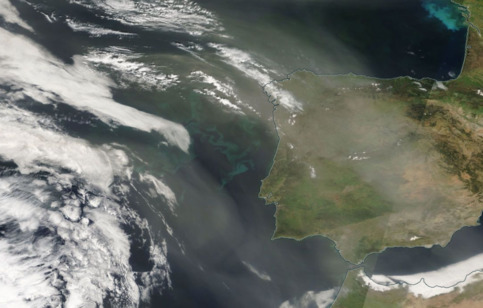
Dust and Plankton near Spain, captured by the MODIS instrument (which can see green and blue)
Notes
| [1] | This is approximately equivalent to a 500m pixel size. The satellite take pictures with a range of different colours, some of these are at a lower resolution. |
| [2] | This is particularly true for ice clouds. You will notice that some of the cloud still appear white - these are primarily the liquid water clouds, which reflect a lot of infrared light from the sun (so create enough fake red light). |
| [3] | GOES (the American instrument) technically still have to fake part of the image, as it doesn't see green. |
| [4] | This is not to say that we didn't get any desert dust information before. MSG used infra-red data to identify dust, typically producing the 'SEVIRI pink dust' images. These are more qualitative in nature, as the background temperature can have a large effect on how visible the dust is in infra-red (Banks et al., ACP, 2019). |
| [5] | The main source of dust from the Amazon actually comes from a dry lakebed in northern Chad - the Bodélé Depression (Koren et al, ERL, 2006). This lakebed is a significant source of phosphorous for the Amazon (Yu et al, GRL, 2015). |
| [6] | In some regions, desert dust deposited in the ocean is responsible for up to 40% of the variation in plankton, although the global impact is smaller. While this is expected to change with warming, how it will change is not clear (Westberry et al, Science, 2023). |
| [7] | It turns out that dusty layers interact with cirrus clouds, changing their properties. As current weather models typically don't consider the impact of dust on cirrus clouds, this produces an error in the forecast (Seifert et al, ACPD, 2023). |